Is this time still the same or different?
What if we are no longer mean reverting to the same mean?
Mean reversion hypothesizes that an asset’s price will tend to converge to its long-term average over time. While this is somewhat true, especially in financial markets where humans participate, the psychological human behavior of greed and fear persistently oscillates and swings like a pendulum between each extreme, causing wildly market highs and lows across time and unavoidable frequent price volatility.
When investing in stocks, publicly traded companies only report their earnings four times a year. Still, the market sets a price almost daily for every second of each stock, causing Price Earnings (P/E) valuation multiples to move wildly frequently while the earnings remain unchanged.
Price Earnings (P/E) Ratio = Stock Price / Earnings per Share (EPS)
Stock Price = Price Earnings (P/E) Ratio x Earnings per Share (EPS)
Notably, there are current measures and forward measures of earnings and valuation multiples, but let’s stick to current measures for now.
The Shiller PE Cyclically Adjusted Price Earnings (CAPE) ratio is often used by “market experts” to indicate whether the current stock market is cheap or expensive. If it is on the higher side, it is “more expensive,” and vice versa; if it is on the lower side, it is “cheaper.”
This provides market participants with some form of mean-reversion measure if the stock market is undervalued or overvalued, allowing them to seek to buy when it is “cheap” and sell when it is “expensive.” After all, most people like a good bargain and do not want to be caught looking silly not selling out at all-time highs.
For context, the CAPE ratio is calculated as the current market price divided by the inflation-adjusted average earnings over the last ten years.
CAPE = Current market price / Inflation-adjusted 10-year Average Earnings
Over the past 100+ years, from 1881 to 1990, the CAPE ratio has historically been between 5X and 25X. As of January 2025, the latest CAPE ratio is ~37X, which is currently elevated. Are stock markets grossly overvalued?
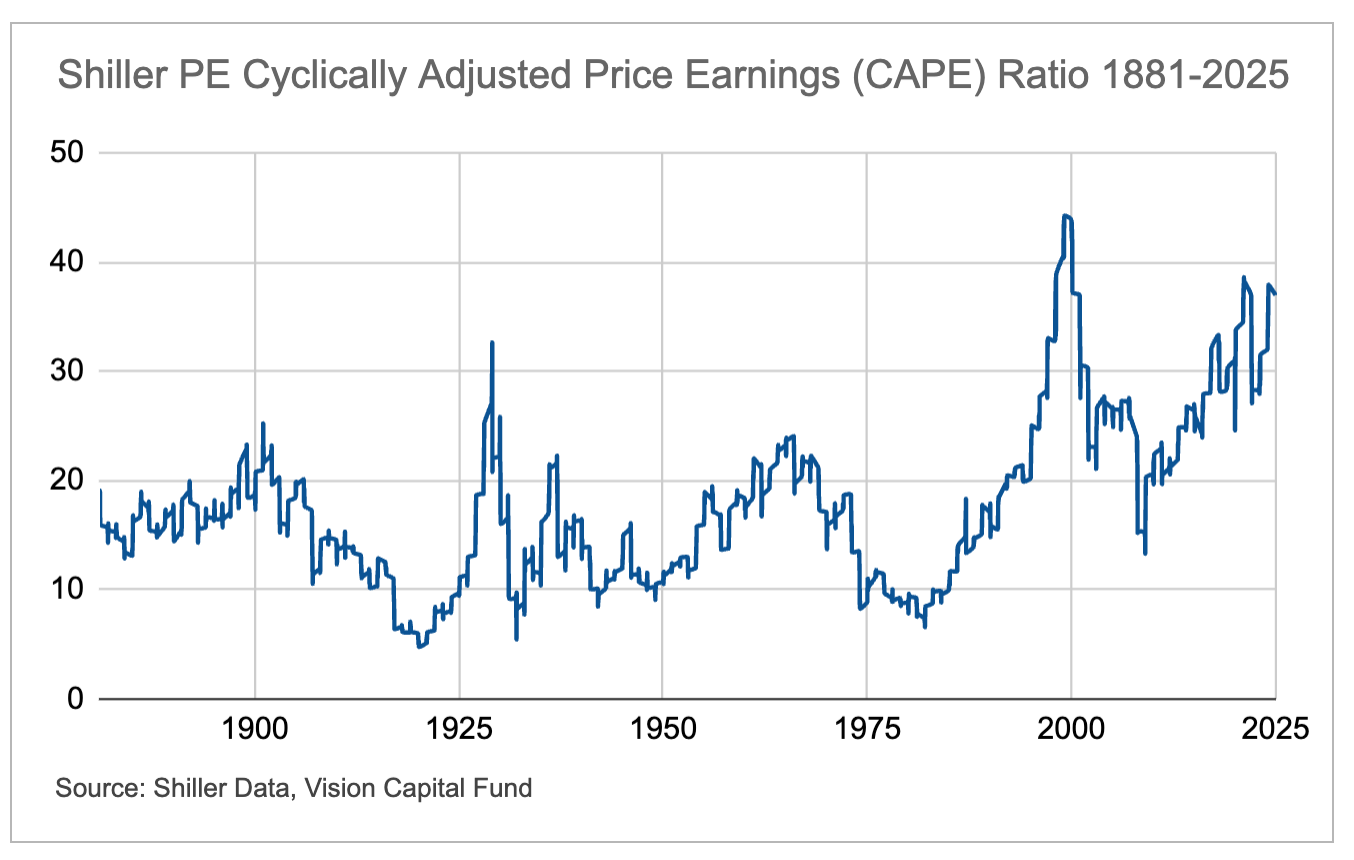
This CAPE ratio “mean reversion” mental model thus infers that one should not own stocks, as current valuations are “expensive” and forward (i.e., one-year) returns are most likely to be “poor.”
However, the statistical analysis of the historical data (see two charts below) tells us otherwise. There is little statistical evidence that the Shiller CAPE is mean-reverting.

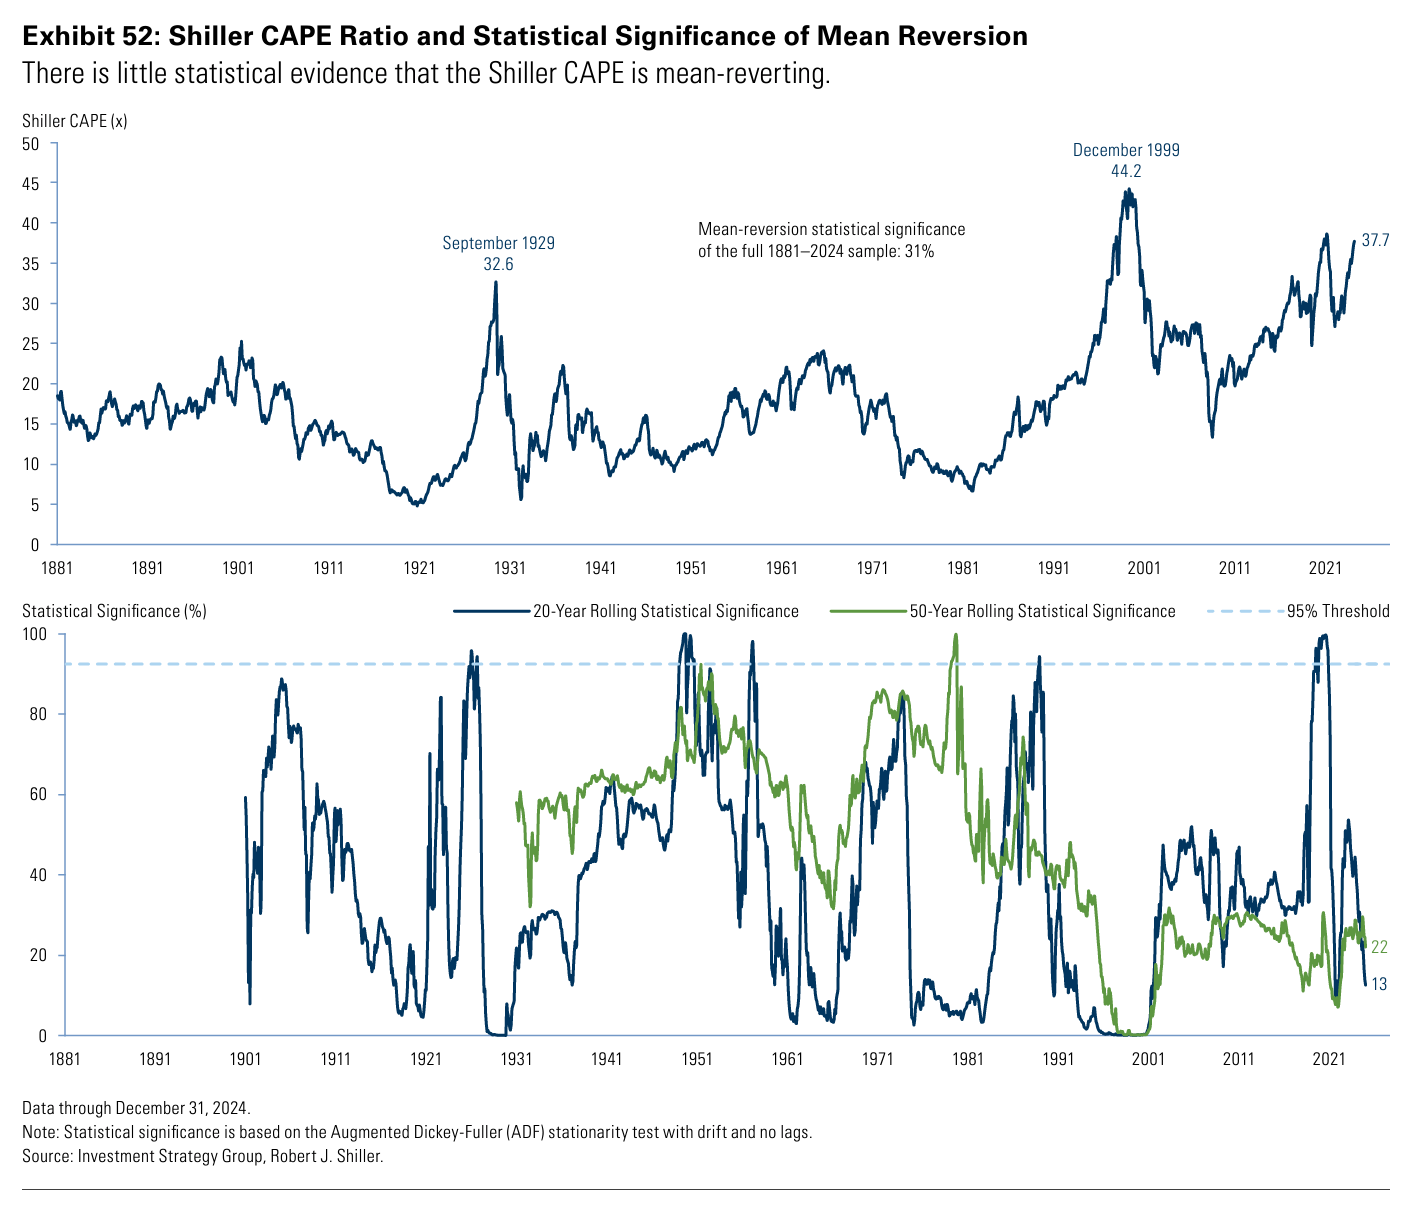
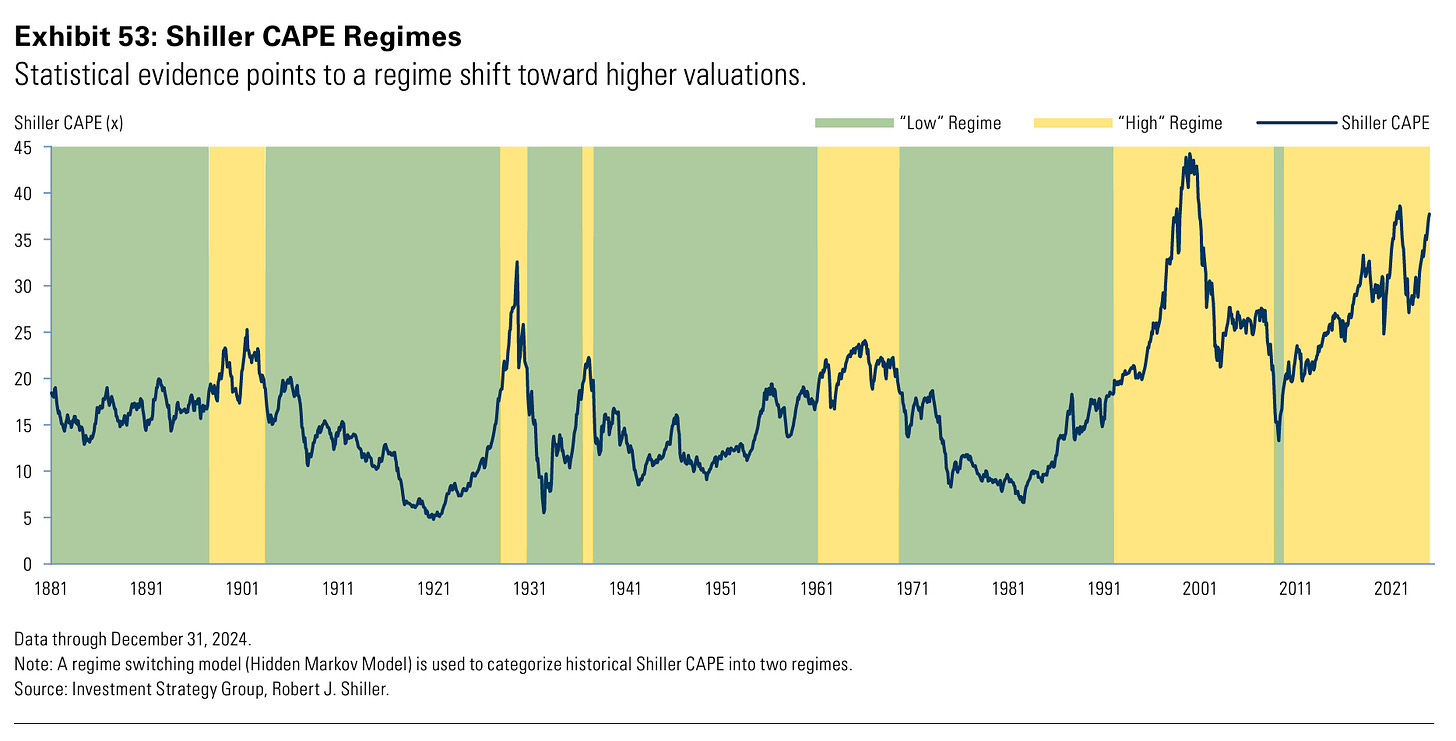
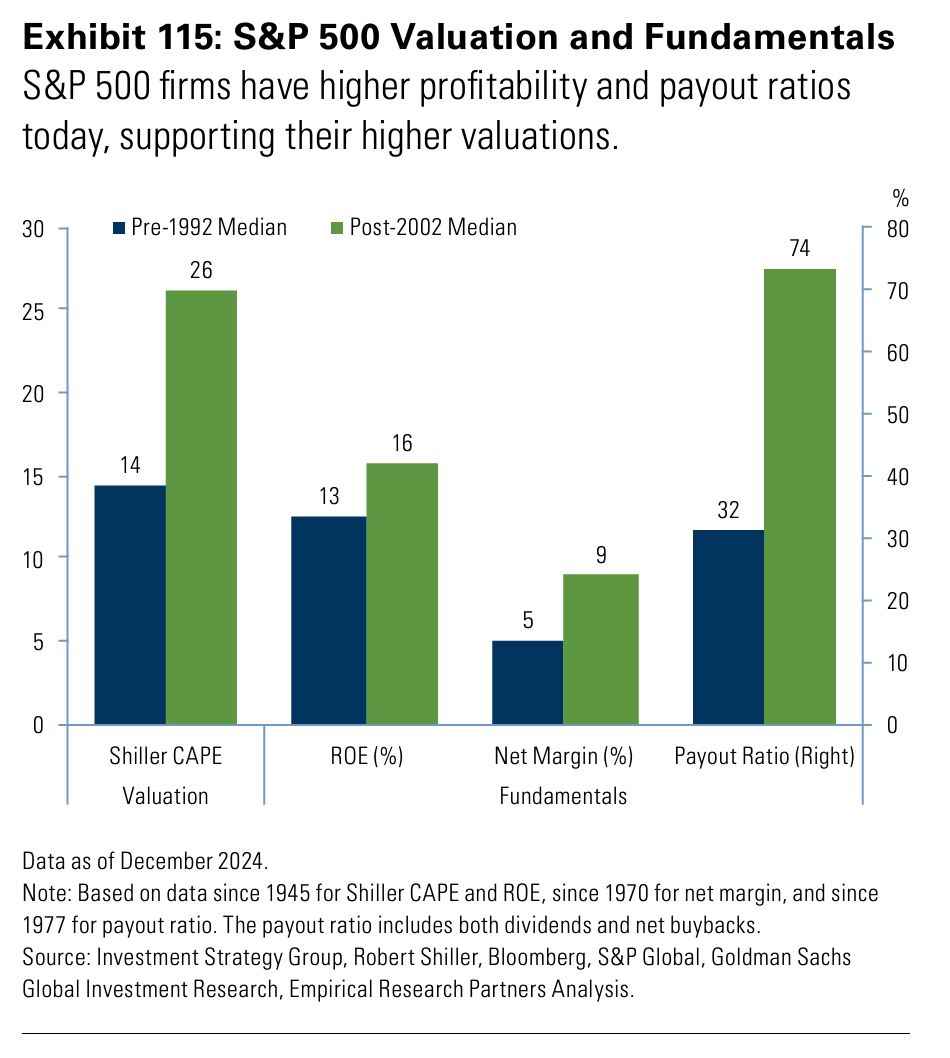
Over the last few decades, CAPE ratio valuations have shifted structurally higher. This persistently elevated valuation challenges the widely held belief that valuations revert to their long-run average over time. Perhaps we are still reverting to the mean, just not the same, but a different and higher one.
The question is if this “high” regime of “higher mean” valuations since the 2002s will continue to persist versus the pre-1992s “low” regime of “lower mean” valuations.

There are several factors. Economic growth has become less volatile over time as the economy has evolved from cyclical manufacturing sectors to more service-based and technology-driven industries. Policymakers are seemingly able to manage shocks and sustain growth better and more, reinforced by the effectiveness of automatic stabilizers, direct fiscal transfers, and unconventional monetary policy.
In addition, there has been a massive growth in passive investments via index funds and exchange-traded funds (ETFs), which are increasingly buying the market capitalization-weighted stock market indices, driving the majority of flows to the largest and most dominant stocks.
That said, the valuation shift could also be a function of other idiosyncratic factors. Today, S&P 500 companies are more profitable (e.g., higher ROE, net income margins) and distribute a larger share of those profits back to shareholders via share buybacks and dividends (e.g., higher payout ratios). In addition, this is skewed by the most dominant companies with the most significant weights (by market capitalization), which operate with significantly higher profit margins (~3X higher).
This superior profitability reflects these companies' substantial competitive advantages, especially network effects. These effects result in a winner or a few winners taking most or all business models, resulting in near-monopolies, duopolies, or oligopolies, where a few top dogs typically dominate.
This results in a different phenomenon: Their competitive advantages are not easily eroded by competition, allowing these companies’ revenue growth rates and profitability to take much longer to mean-revert to base rates. This enables them to grow faster and make more money for longer, which can provide opportunities for the astute stockpicker aware of the changing broader dynamics at play.

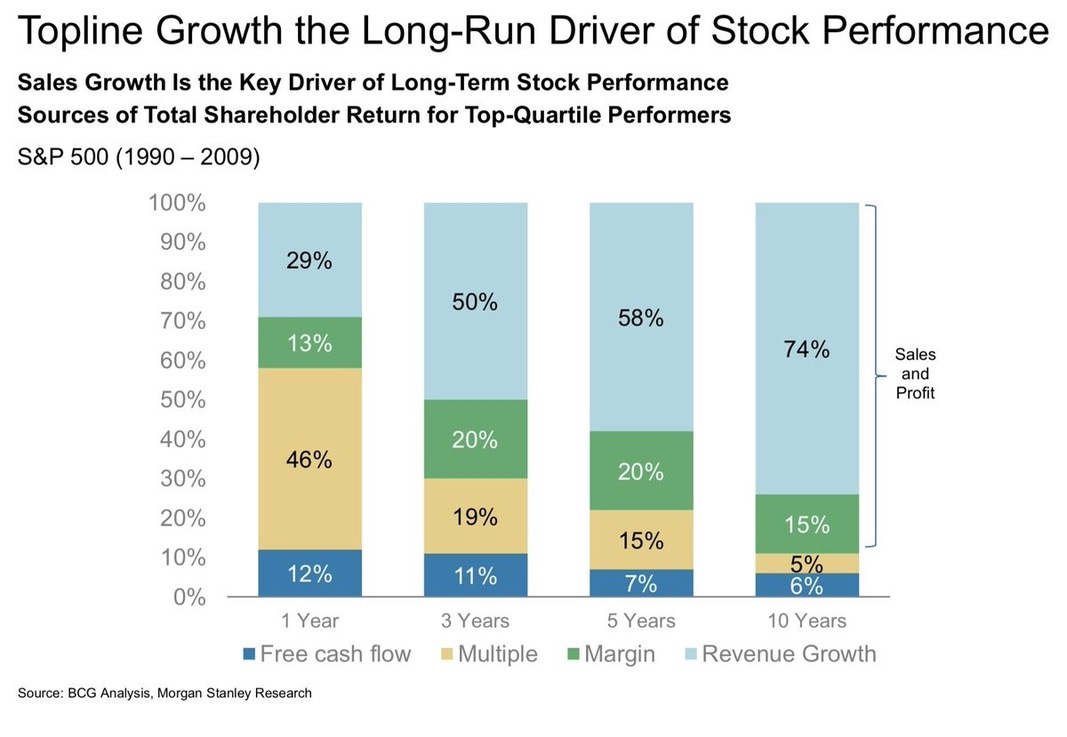
As we always say, where earnings go, stock prices eventually flow. Earnings growth is the most significant longer-term driver of higher stock prices. Once you realize earnings are the weighing machine, you will ignore the short-term noise and the voting machine.
If you are optimistic enough and think earnings for your own companies will continue to head higher (like we do), you are probably better off staying invested through the market's ups and downs. Find a few companies that can grow earnings 15-20%+ CAGR for 10-20+ years, and there is a good chance you will do well.

Valuations and prices do matter. You will likely do poorly if you buy a good business for an exorbitant price. However, you could still do well if you buy an excellent, growing company at an expensive price.
In the short term, the change in valuation multiples drives most stock market returns (~46% over 1 year). Over the longer term, revenue growth, profits, and free cash flows drive the significant majority of shareholder returns (~95% over 10 years).
Closing Words
While many things tend to mean revert, it is essential to know if the reversion to the mean is still to the same mean or a different one. Sometimes, things change, and sometimes, certain things don’t. If things are structurally changing, it is essential to track what does and evolve dynamically accordingly constantly. Have strong convictions, loosely held.
Separately, Vision Capital Fund’s 2024 annual investor letter is now available.
In addition, I am teaching my 3rd cohort of the Vision Investing course, which runs from 18 Feb -6 Mar 2025, over six live Zoom sessions. You can get a chance to learn about stock investing from a practitioner who has repeatedly demonstrated results.
All net course proceeds are donated to the Vision Give Back Fund, where 20% of annual gains are donated to philanthropic causes. I only teach this once a year. The next one will be a year from now. Use the “VISION20” discount code to get 20% off. This discount is limited to the first 20 signups; sign up before the deadline ends soon.
11 January 2025 | Eugene Ng | Vision Capital Fund | eugene.ng@visioncapitalfund.co
Find out more about Vision Capital Fund.
You can read our annual letters for Vision Capital Fund and Vision Capital. If you would like to learn more about our new journey with Vision Capital Fund, please get in touch with us.
Follow us on Twitter/X @EugeneNg_VCap.
Check out our book on Investing, Vision Investing: How We Beat Wall Street & You Can, Too. We believe the individual investor can beat the market over the long run. The book chronicles our entire investment approach. It explains why we invest the way we do, how we invest, what we look out for in companies, where we find them, and when we invest in them. It is available via Amazon in two formats: paperback and eBook.
Join our email list for more investing insights. Our emails tend to be ad hoc and infrequent, as we aim to write timeless, not timely, content.


