
26 Jun 2022 | Eugene Ng | Founder & CIO | Vision Capital |
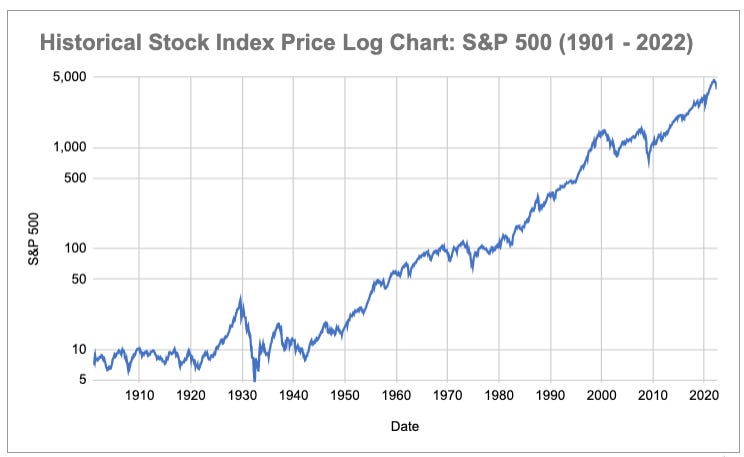
The Stock Market does rise over time.
When you buy a stock, you want the stock price to go up.
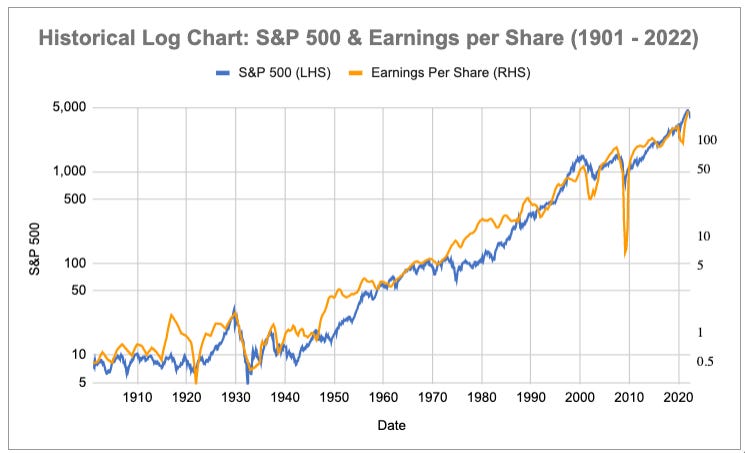
The good news is stock markets go up over time.
Most countries’ financial stock markets generally rise over a sufficiently long period of time, in decades. Certainly not years, months, weeks, and definitely not days.
The historical logarithmic price chart below of the US S&P Composite Index from 1901–2022 (courtesy of data from Robert Shiller) illustrates this point best.
Yet, while stock prices go up, not everyone understands why stocks behave the way they do.
In particular: “Why do stock markets go up?”.
There are many answers to this age-old question, but not all point to the truth.
The quest for the answer to this question, would then be able to guide our north star towards what we should be looking for, in our investing framework and philosophy.
What does Traditional Financial Media tell us?
A Google Search of “Why does the Stock Market go up?”, and Investopedia gives you up a broad range of factors.
The factors range from the supply and demand of buyers and sellers, to economic indicators, consumer confidence, wars/politics, concerns over inflation / deflation, government fiscal / monetary policy, technological changes, natural disasters or weather events, corporate or government performance data, regulation/deregulation, and the level of trust in the financial sector and legal system, amongst so many others.
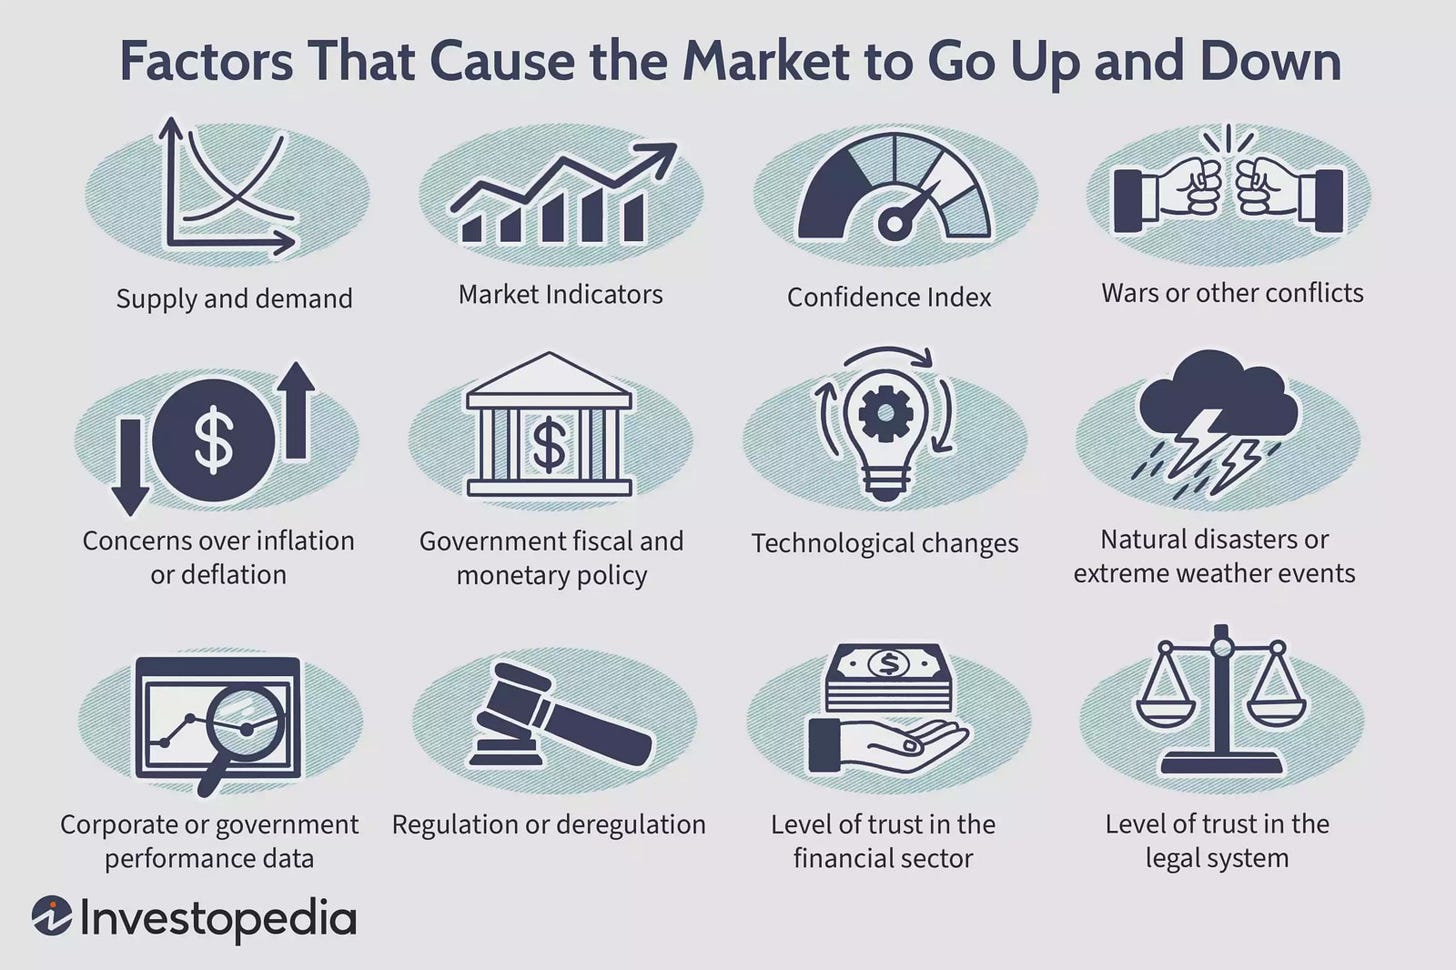
But this doesn’t really answer the question, doesn’t it? It only leaves you, more confused, and begging for a better answer.
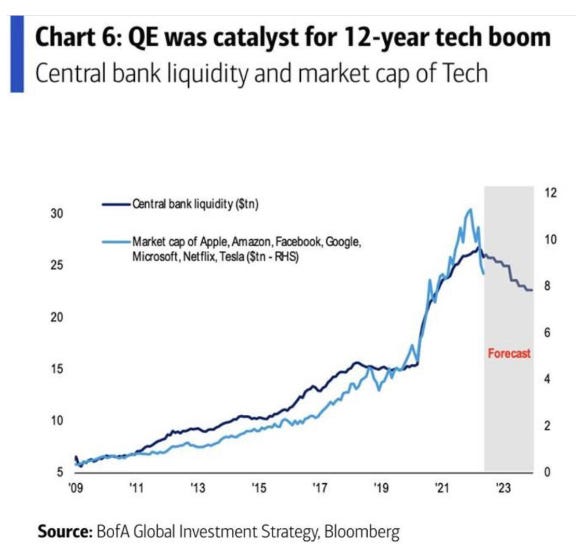
Even worse, sell-side investment banks will on occasion attempt a “chart crime” such as the one below, e.g. using “Central Bank / Quantitative Easing” as an explanation of why certain stocks go up over the last 13 years.
The result is, a horrific explanation.
Simply said…
Correlation, does not imply causation.
Asking the Right Question
The factors listed above are not wrong. Yet, they do not help you figure out why stock prices rise.
In the short-term, stocks will move up and down for a variety of random reasons — all of which does nothing to increase your chances of a positive return.
Thus a better question would be:
“Since the short-term does not really matter as much, why then does the stock market go up over the long-term?”
To get closer to the truth, you need to understand the components which drive the returns on your stock investment.
Decomposition of Total Shareholder Returns
The Total Shareholder Return (TSR) from holding common publicly-traded stocks can be broken down into three key components: (1) growth in Earnings per Share (EPS), (2) change in the Price-to-Earning (PE) valuation multiples, and (3) earnings from dividends.
The TSR is then easily calculated by multiplying (1) EPS growth by (2) PE multiple growth, and adding back dividend yield.
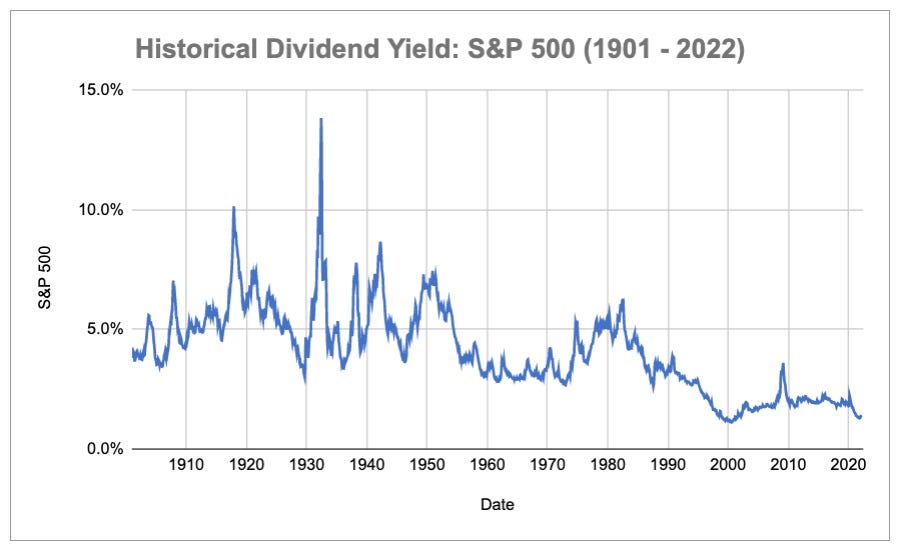
Unfortunately, dividend yields have been on the gradual decline, declining from an average of ~5.4% during 1900–1950, to an average of ~1.9% over the last 20+ years (2000–2022).
The latest dividend yield as of Mar 2022 is ~1.4%.
As such, dividends may not do enough heavy lifting to increase your returns.
To simplify, we will look at historical Total Shareholder Returns on a ex-Dividend basis (TSR*), and focus on what really contributes to the rising stock market index over the long time.
Essentially, there are two key drivers, the earnings per share (EPS) growth and the change in Price-to-Earnings (PE) valuation multiple.
Starting from the first factor, we can break down EPS growth further into two components: growth in Sales per Share (SPS) and Net Income Margin (NIM) growth.
Do note that Sales Per Share (SPS) Growth implicitly factors in an increasing or decreasing share count, i.e. share dilution from stock based compensation or accretion from share buybacks.
By combining growth in Sales per Share (SPS) and growth in Net Income Margin (NIM) into Total Shareholder Returns (TSR*) on a ex-Dividend basis, we then get the following formula:
With the formula in place, we can look at how each component has contributed to in the past.
What does the historical data tell us?
With S&P Global providing us with historical data on the S&P 500’s closing levels, Sales per Share (SPS), Earnings per Share (EPS) and Dividend per Share (DPS), they provide clues on what the growth has been thus far.
The figures in the table below are calculated are on a rolling basis with 2003 as a base comparison.
In other words, 2021 will be calculated versus 2003, 2020 versus 2003, 2019 versus 2003 and so on.
This approach allows us to zoom out, and truly focus on what drives TSR* over the longer-term, rather than on a shorter-term year-on-year basis, which is much more volatile.
Take 2021 to 2003, the longest period spanning over 18 years (first row, last 5 columns from the right). During this time, the S&P 500 Index more than quadrupled from 1,112 to 4,766, with TSR* growing by ~4.3X (8.2% CAGR).
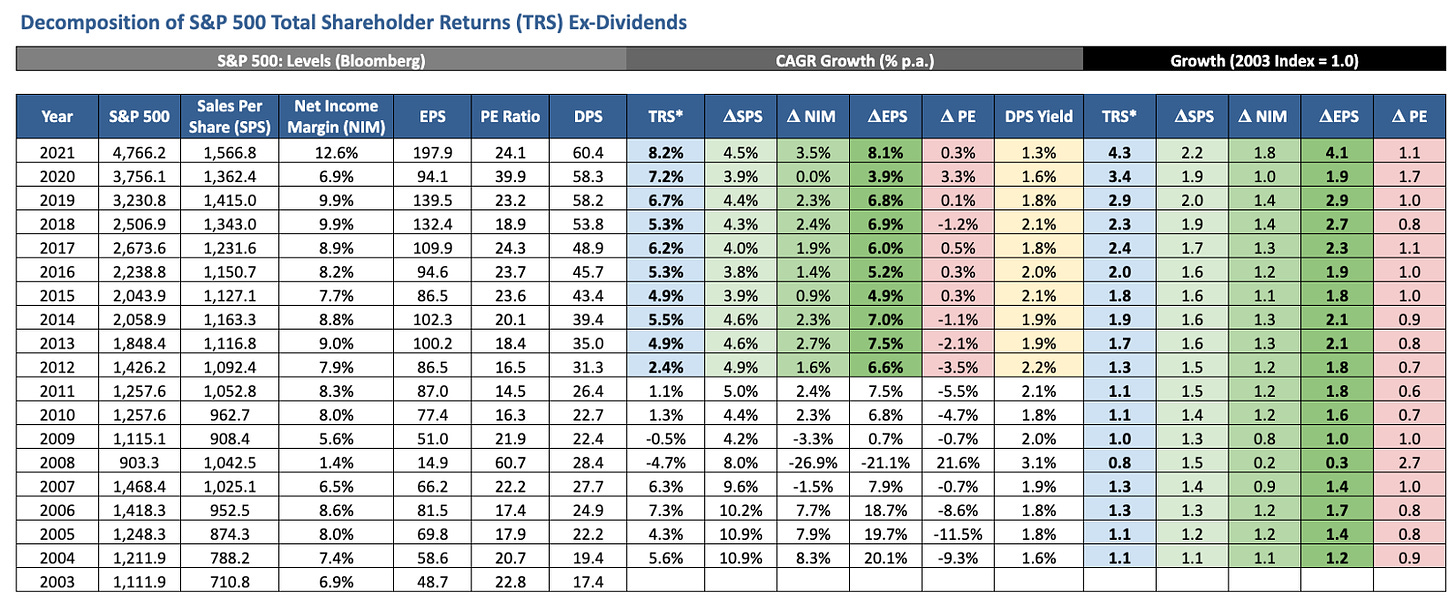
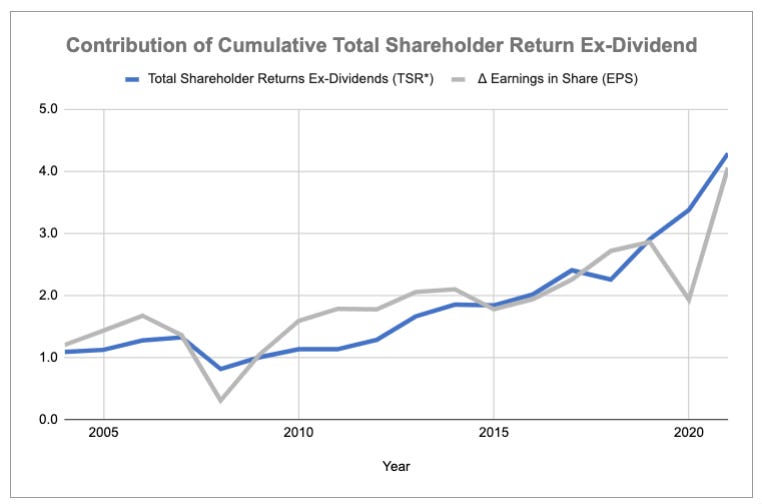
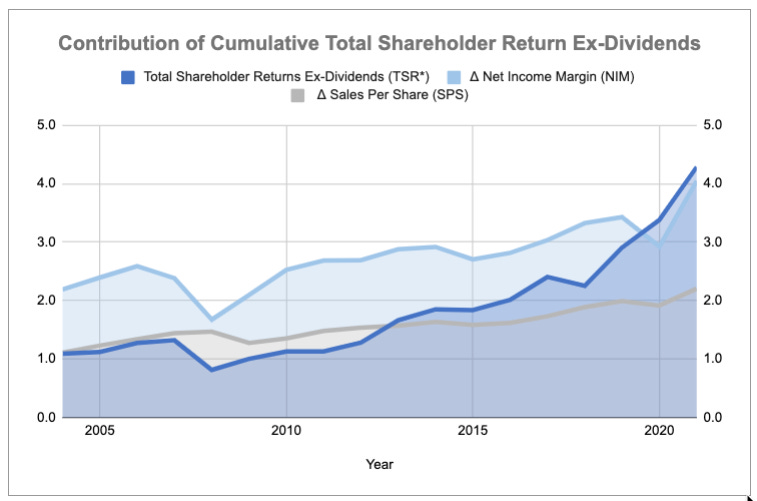
The contribution of the Earnings per Share (EPS) growth is telling. Earnings per Share (EPS) grew by ~4.1X (8.1% CAGR) from 48.7 to 197.9. Further breaking down that EPS growth, Sales per Share (SPS) grew by ~2.2X (4.5% CAGR) and Net Income Margin Growth (NIM) grew by ~1.8X (3.5% CAGR).
Thus the growth in earnings (EPS) accounted for the majority (~95%) of the TSR* growth, with growth in sales/revenues (SPS) and improvement in net income profit margins (NIM) accounting for ~52% and ~43% of TSR* growth respectively.
Valuation multiples matter less over the long-term.
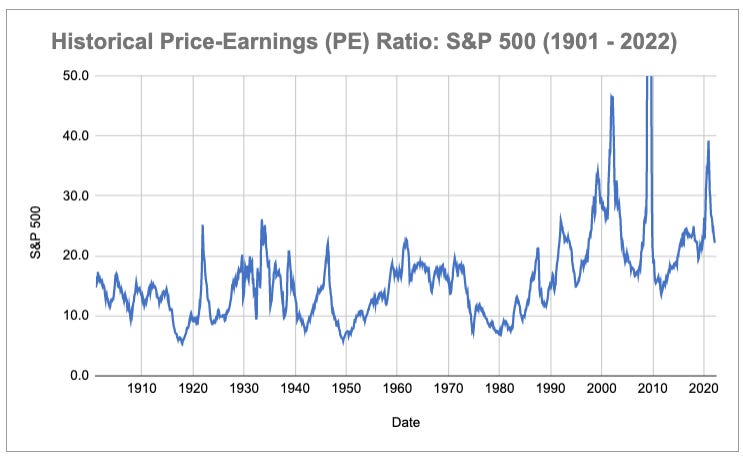
By comparison, the Price-to-Earnings (P/E) valuation multiple is far less reliable and more volatile, especially in the short term.
The key to note is that the change in Price-to-Earnings (P/E) valuation multiples (last column) can vary significantly from year to year.
From one year to the next, it can be higher, and it can be lower, ranging from 0.6X to 2.7X.
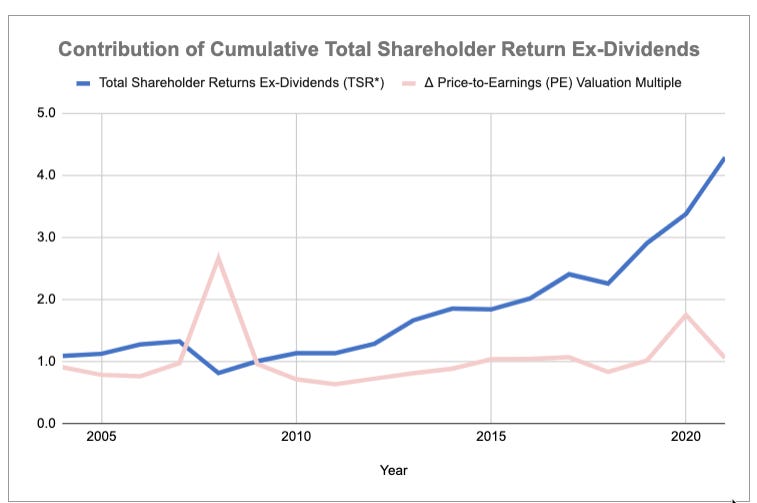
But in time frames of greater than 10 years, the change in Price-to-Earnings (P/E) valuation multiples tend to generally hover around a far smaller range of 0.8–1.1X.
Note 2020 was an outlier exception at 1.7X, where earnings collapsed due to COVID-19, and yet the stock market closed up higher.
That said, valuation multiples also do tend to revert to the mean, swinging from either extreme lows and highs, like a pendulum.
This phenomenon is really the market’s expectations / Mr Market’s optimism or pessimism, often caused or attempted to be explained by many of the numerous factors highlighted earlier by Investopedia.
These random variables create volatility in daily stock price movements and valuation multiples, in contrast to the underlying business performance which only reports results quarterly, four times a year.
Said another way, if you choose to invest for the short-term (i.e. 1–2 years and less), the price (i.e. valuations) at which you buy at, matters a lot.
But if you are investing for the long-term (i.e. 3–5 years and more), valuation multiples and accordingly the price, tend to matter much less.
Revenues & Earnings Growth drive the majority of Long-term Stock Market Returns
Given what we have laid out so far, you, you should not be surprised to learn that over the long-term, it is earnings growth, supported by revenue and profit growth, that drives the stock market higher, and to a much lesser extent, valuation multiples.
Hence…
Where revenues, profits and cash flows^ eventually go, the stock price always eventually flows. — Eugene Ng
“In the short run, the market is a voting machine. But in the long run, it is a weighing machine.” — Benjamin Graham
The key drivers of long-term stock price growth align well with what we do at Vision Capital, to find and own companies that keep growing revenues and profits durably, rather than hoping for the kindness of Mr. Market to award us with a higher earnings multiple.
That’s not all, the companies that we own are doing so, and are also the ones that are innovating, disrupting and changing the world for the better.
We hope you will join us too, in this visionary quest to make your portfolio reflect your best vision of the future, changing and shaping the world for the better.
With more people coming onboard, we can be a powerful force of good.
Many thanks to Chin Hui Leong (The Smart Investor) and Chong Ser Jing (The Compounder Fund & The Good Investors) for your comments and suggestions as always.
^ Cash Flows: On a side note, with the rise in intangibles, and R&D being immediately expensed rather than being capitalised. And alongside volatile investment gains/losses in GAAP Net Income, earnings have actually become a relative poorer measure over time of a company’s true earnings power.
In fact, our preferred measure is Free Cash Flow (FCF), which is Operating Cash Flow less Capital Expenditures (CAPEX). This includes reinvested capital that is needed to grow & maintain the business. However, data with Free Cash Flow (FCF)and Enterprise Value is not readily and easily available.
Perhaps when the data is available, this note would be extended to do a decomposition using Free Cash Flow (FCF), instead of earnings / net income.
26 Jun 2022 | Eugene Ng | Vision Capital Fund | eugene.ng@visioncapitalfund.co
Find out more about Vision Capital Fund.
You can read my prior Annual Letters for Vision Capital here. If you like to learn more about my new journey with Vision Capital Fund, please email me.
Follow me on Twitter/X @EugeneNg_VCap
Check out our book on Investing, “Vision Investing: How We Beat Wall Street & You Can, Too”. We truly believe the individual investor can beat the market over the long run. The book chronicles our entire investment approach. It explains why we invest the way we do, how we invest, what we look out for in the companies, where we find them, and when we invest in them. It is available for purchase via Amazon, currently available in two formats: Paperback and eBook.
Join my email list for more investing insights. Note that it tends to be ad hoc and infrequent, as we aim to write timeless, not timely, content.


